Client: Mirza Mohammad Ali Baig, medical student and researcher, Riphah International University
Field: Epidemiology / stroke / neurovascular
Figure type: Central illustration (infographic)
Status: Manuscript
Delivered: High-resolution PNG and editable Adobe Illustrator file
The brief
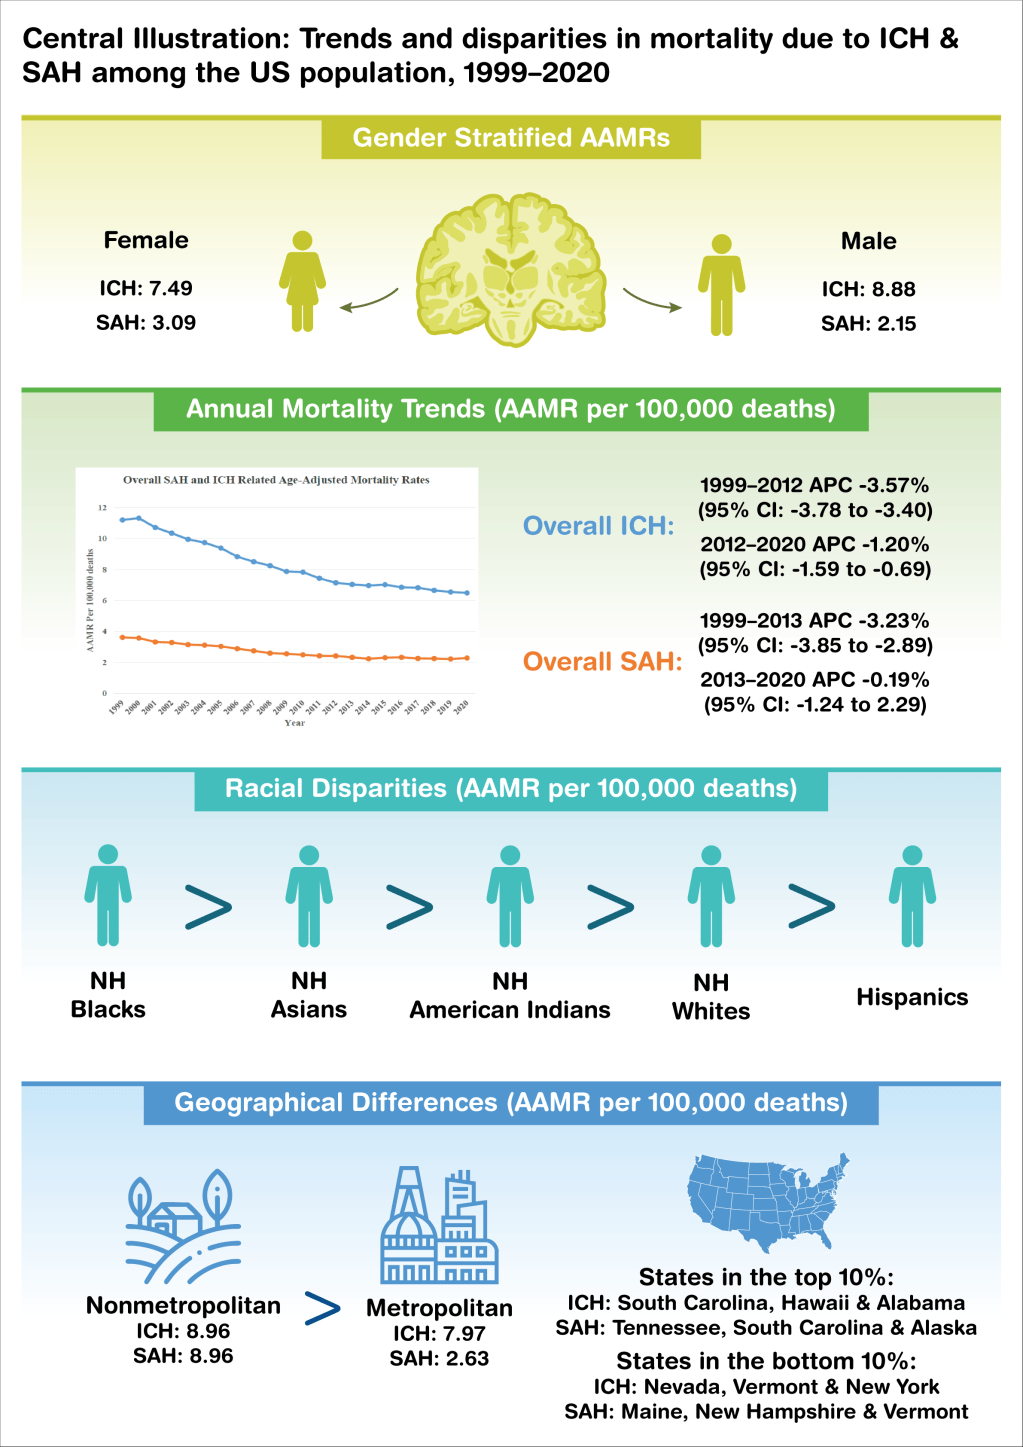
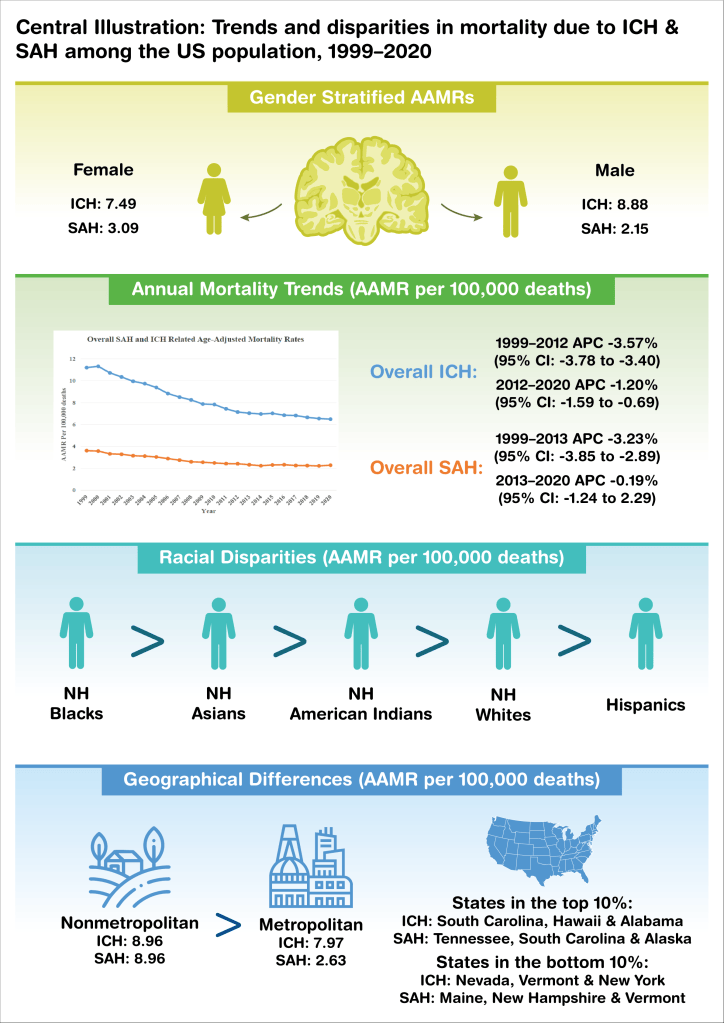
Mirza’s study used CDC WONDER data to examine US mortality from intracerebral hemorrhage (ICH) and subarachnoid hemorrhage (SAH) between 1999 and 2020. He needed a central illustration, the one-page visual summary many cardiology and neurology journals ask for, that a reader could take in before reading the paper.
The challenge
Epidemiology results are mostly numbers: rates, percent changes, confidence intervals, and rankings. A central illustration has to make those numbers scannable without turning into a table, and every value still has to be exact.
My approach
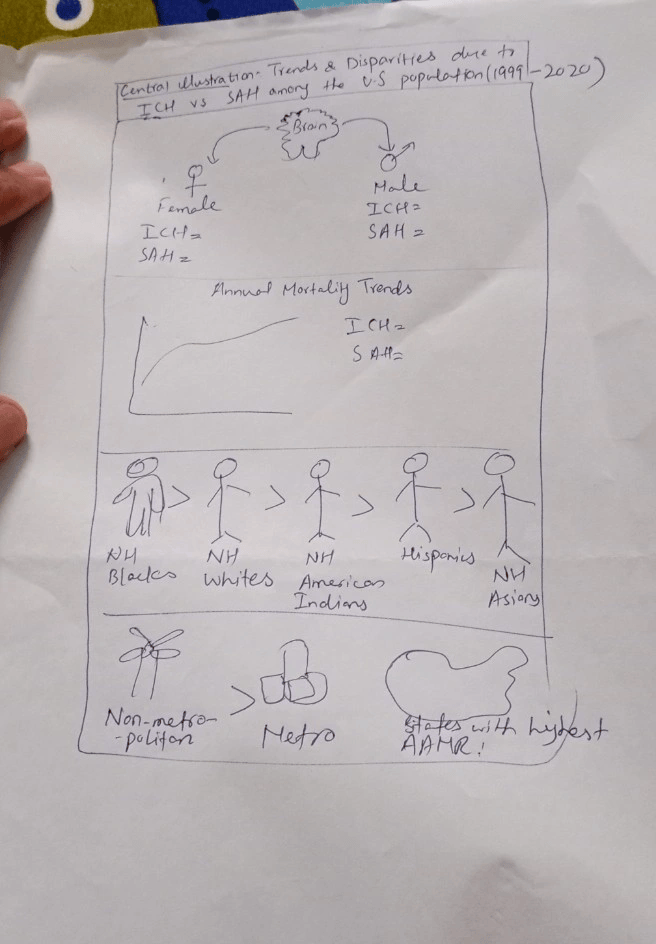
I divided the page into four stacked bands, each with its own color and its own question.
Sex: female and male figures on either side of a brain, each with its ICH and SAH rates.
Trends over time: the mortality curve from the paper, placed beside the annual percent change for each period so the reader sees the shape and the statistics together.
Race and ethnicity: five figures in a row joined by “greater than” signs, so the ranking reads in one glance.
Geography: rural and urban icons with their rates, and a US map with the states at the top and bottom of the range.
The result
A one-page summary of two decades of data that a reader can follow top to bottom in under a minute. In Mirza’s words: “He understood the concept right away and turned it into something clear, professional, and visually engaging.”
Need a central illustration or visual abstract for your study? Start a project →