Client: Amirhossein Mohammad Zaheri, medical student, Kurdistan University of Medical Sciences
Field: Neurosurgery / neuro-oncology
Figure type: Comparison illustration
Used for: Presentation
Delivered: High-resolution PNG and editable Adobe Illustrator file
The brief
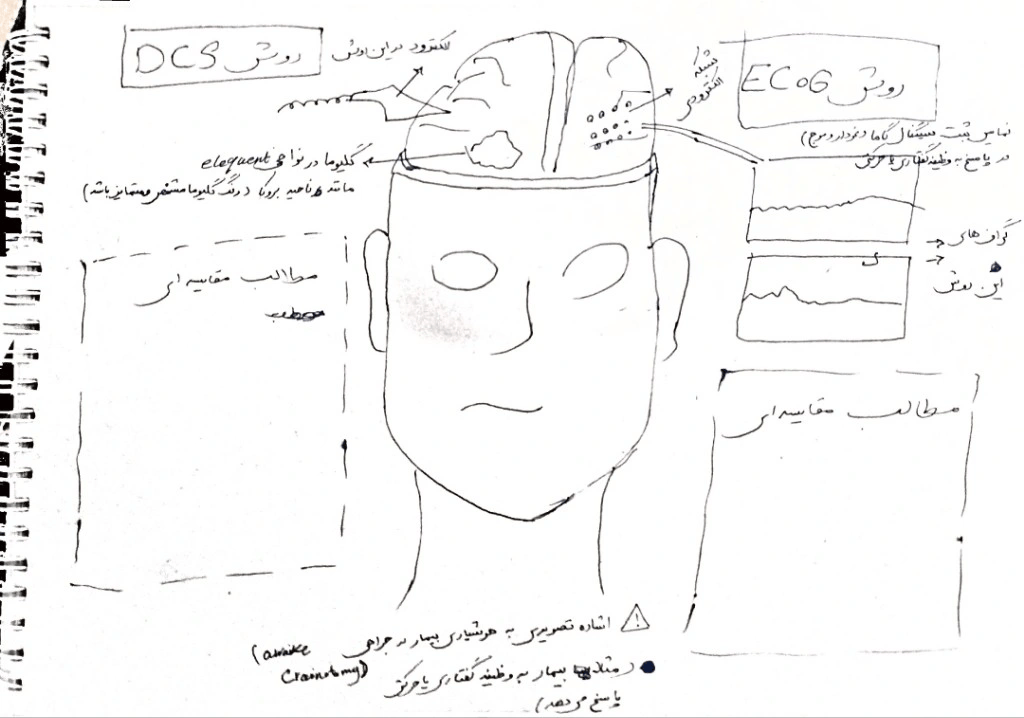
Amirhossein needed one figure comparing the two main functional-mapping techniques in awake glioma surgery: direct cortical stimulation (DCS) and electrocorticography (ECoG). He sent me a rough sketch with the key points for each method and asked for something a reader could understand at a glance.
The challenge
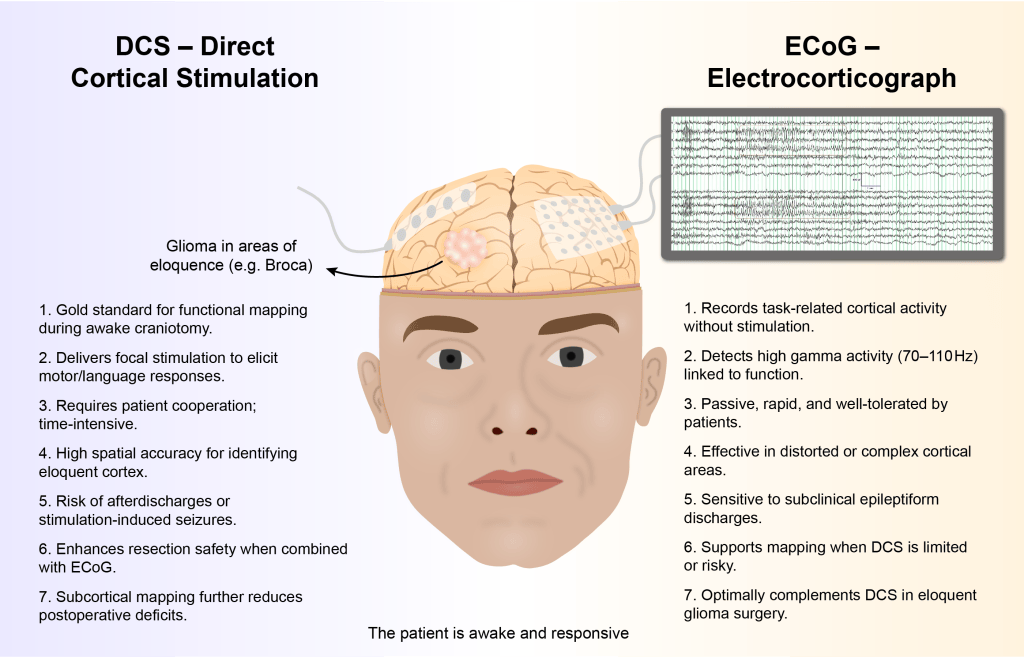
DCS and ECoG are often used together in the same operation, so the figure couldn’t present them as rivals. It had to show where each electrode sits, what each technique actually measures, and where each one is stronger, without becoming a wall of text.
My approach
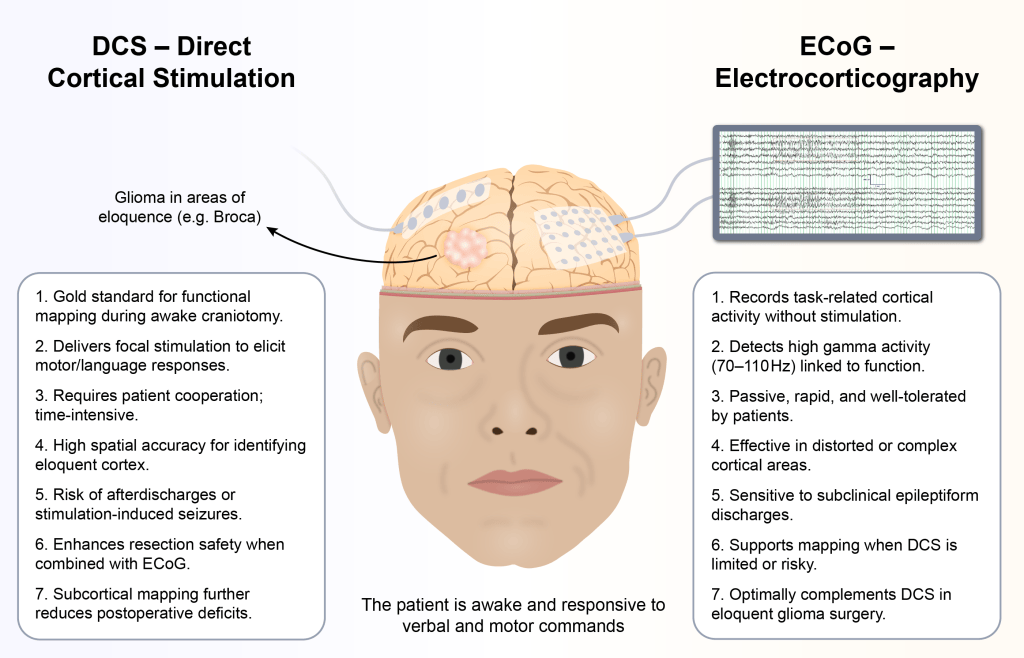
I built the figure around a single patient. An awake face sits in the center, with the cortex exposed above it, and anchors both sides of the comparison.
Left, DCS: a strip electrode stimulating cortex next to a glioma near Broca’s area. This shows the classic scenario where mapping matters most: a tumor in eloquent cortex.
Right, ECoG: a grid electrode connected to a live cortical recording, showing that this technique listens rather than stimulates.
Two numbered lists of seven points each set the strengths and limitations side by side, so readers can compare the methods line by line. One shared caption under the patient (“The patient is awake and responsive to verbal and motor commands”) ties both techniques back to the clinical setting.
I reduced the background colors’ saturation and put the text in boxes for better readability.
The result
A clean, balanced figure that explains two complex intraoperative techniques in one view, suitable for a manuscript, a lecture slide, or a teaching handout.
Have a method or comparison that needs explaining visually? Start a project →