Client: Own research (co-author)
Field: Cell biology / autophagy / vascular biology
Figure type: Multi-stage pathway illustration
Published: Frontiers in Cell and Developmental Biology (2024), Role of autophagy in angiogenic potential of vascular pericytes
Delivered: High-resolution PNG and editable Adobe Illustrator file
The brief
This review explored how autophagy shapes the angiogenic behavior of vascular pericytes. Before getting to pericytes, readers needed a clear picture of autophagy itself: which proteins act at each stage and in what order. This was my first published scientific illustration.
The challenge
Autophagy involves more than twenty core proteins, many with similar names (ATG2, ATG5, ATG7, ATG9A, ATG12, ATG13…), working in overlapping complexes. Drawn as one network, it becomes a tangle that even specialists struggle to follow.
My approach
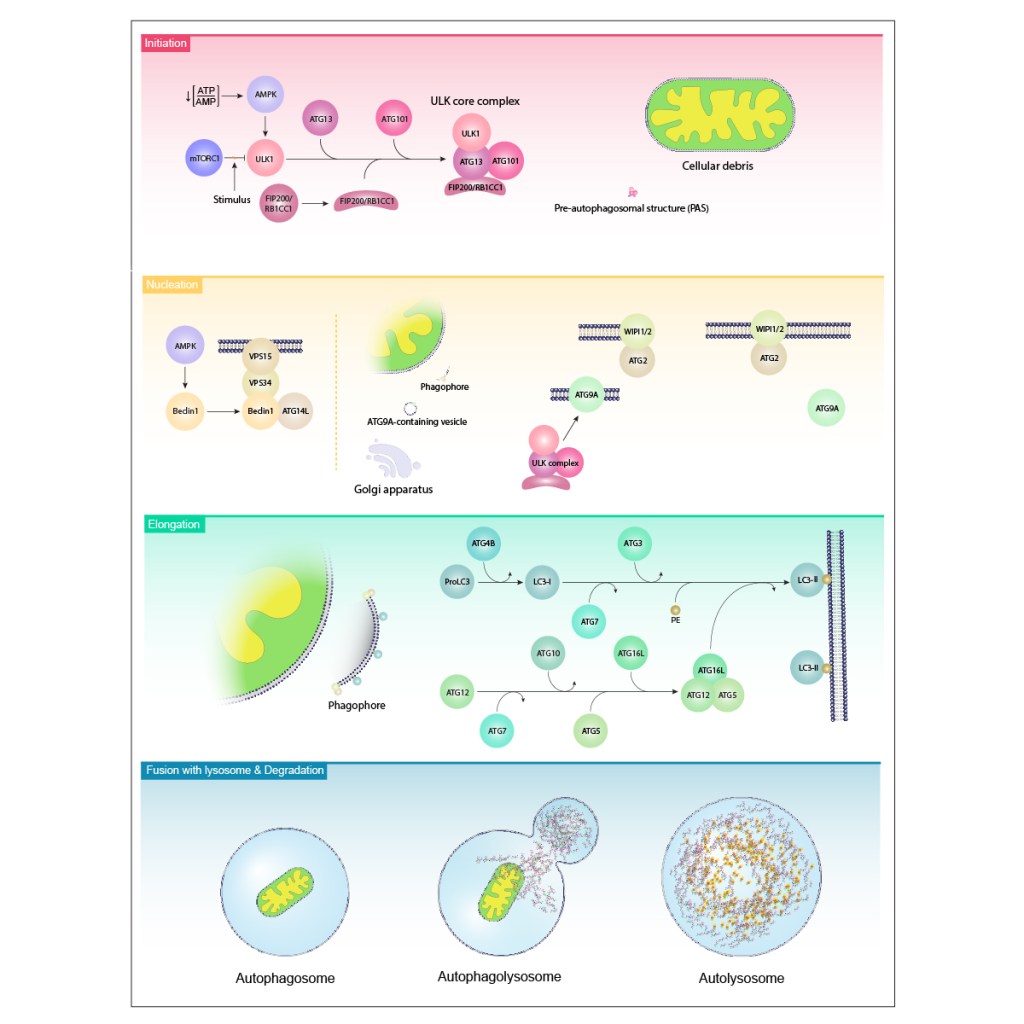
I split the pathway into four horizontal bands, one per stage, read from top to bottom.
Initiation: energy stress activates AMPK, which releases ULK1 from mTORC1 inhibition. ULK1 then assembles with ATG13, ATG101, and FIP200 into the ULK core complex.
Nucleation: the Beclin1–VPS34–VPS15–ATG14L complex and ATG9A-containing vesicles start building the phagophore membrane, with WIPI1/2 and ATG2 at the growing edge.
Elongation: two conjugation systems run in parallel: LC3 processing to membrane-bound LC3-II, and assembly of the ATG12–ATG5–ATG16L1 complex.
Fusion and degradation: the finished autophagosome fuses with a lysosome and its contents are broken down.
Each band has its own color, and the colors follow the order of a spectrum from top to bottom. The progression quietly tells the reader that this is a sequence, before they read a single label.
The result
A pathway figure that turns a crowded molecular network into four readable steps. It works for a review introduction, a lecture on cell biology, or as a reference figure in a grant on autophagy.
Need a complex pathway made readable? Start a project →